


In an increasingly digitized era, every interaction has become a constant data flow. From the first moment of the day, when we turn on our mobile phones upon waking up, to the last glance at our screens before going to sleep, we generate and share data incessantly. Most industries rely on data analytics to make informed and efficient decisions. In this scenario, digital marketing emerges as one of the areas where data generation and analysis are crucial for success. Specifically, programmatic advertising is a clear example of how data drives modern advertising strategies. Programmatic advertising has become indispensable in reaching specific audiences efficiently and personally, thus maximizing the ROI and effectiveness of advertising campaigns in an environment where every impression, click, and conversion counts.
Programmatic advertising has revolutionized digital marketing strategies, offering an unprecedented level of targeting and personalization. However, obtaining and analyzing data can become tedious and complicated for media buying teams immersed in this digital world.
Imagine for a moment finding yourself in front of several advertising platforms, each with its own interface and restrictions on information access and manipulation. Media buying teams face the reality of editing and configuring the same report multiple times to view specific data daily. In addition, these platforms often provide poorly segmented data or experience interminable load times when making changes, making it difficult to analyze and quickly resolve issues fully.
Also, the programmatic advertising “game” involves multiple characters, concepts, and metrics. Advertisers, publishers, Ad Exchanges, campaigns, bundles, geos, clicks, impressions, installs, costs, etc. the possibilities are endless. Finding winning combinations among all these concepts using platform dashboards can take a long time.
As with problems, we can also miss out on good business opportunities because, sometimes, what separates us from having new ideas is the time it takes to realize them.
Many of these platforms, to a greater or lesser extent, allow us to run reports with large amounts of data, but often, we don’t know how to deal with them, ergo feeling overwhelmed. We continue to work “the old-fashioned way,” loading online dashboards endlessly.
Of course, if I can’t even work those reports in Excel without crashing every two minutes, how am I going to work with so much data?
Well, the reality is not that these amounts of data are useless, but that we have to find the tools to work with them without dying in the attempt.
As the well-known expression goes, a lazy person will always find a way to do a tedious task faster. One of those ways is to use data visualizers.
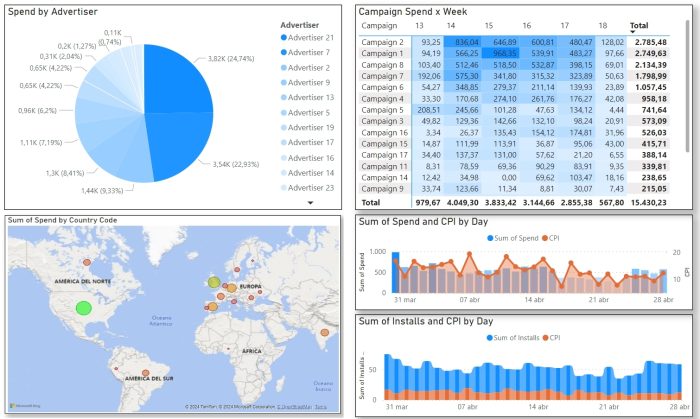
There are many tools on the market that can help us take advantage of this huge amount of data, and one of them is Power BI, a data visualization tool that allows us to load heavy data documents and work with them without losing a second in loading times.
We can create all kinds of graphs, tables, matrices, filters, etc.; best of all, we can do it as granularly as we want.
These are some of its main advantages:

The use of Power BI, like some other visualization tools, in the context of programmatic advertising represents a significant advance in the ability of companies to understand, optimize, and maximize the performance of their digital advertising strategies. With its advanced data analytics and visualization capabilities, Power BI enables marketers to make informed, data-driven decisions in real-time, quickly adapting to market demands and delivering meaningful results. With its intuitive interface and extensive connectivity, it has become an indispensable tool for those looking to stay ahead in the competitive world of digital advertising.
In an environment where every click and conversion counts, Power BI allows companies to drive campaign success, maximize ROI, and gain a competitive advantage in an ever-evolving marketplace.
Subscribe to our newsletter
Important Security Notice
Beware of scammers impersonating Tappx brand
We have identified fraudulent activities where malicious actors are imitating Tappx assets. These scams may compromise your security.
⚠️ Warning: The URL you came from has been flagged as potentially harmful.
To stay safe, only trust communications and services from the official Tappx domain: tappx.com